TSrepr - R package for time series representations
TSrepr is R package for fast time series representations and dimensionality reduction computations (i.e. time series feature extraction). Z-score normalisation, min-max normalisation, forecasting accuracy measures and other useful functions implemented in C++ (Rcpp) and R. TSrepr package is available on CRAN.
Installation
You can install TSrepr directly from CRAN:
install.packages("TSrepr")Or development version from GitHub with:
# install.packages("devtools")
devtools::install_github("PetoLau/TSrepr")
Overview
All type of time series representations methods are implemented, and these are so far:
- Nondata adaptive:
- PAA - Piecewise Aggregate Approximation (
repr_paa) - DWT - Discrete Wavelet Transform (
repr_dwt) - DFT - Discrete Fourier Transform (
repr_dft) - DCT - Discrete Cosine Transform (
repr_dct) - SMA - Simple Moving Average (
repr_sma) - PIP - Perceptually Important Points (
repr_pip)
- PAA - Piecewise Aggregate Approximation (
- Data adaptive:
- SAX - Symbolic Aggregate Approximation (
repr_sax) - PLA - Piecewise Linear Approximation (
repr_pla)
- SAX - Symbolic Aggregate Approximation (
- Model-based:
- Mean seasonal profile - Average seasonal profile, Median seasonal profile, etc. (
repr_seas_profile) - Model-based seasonal representations based on linear (additive) model (LM, RLM, L1, GAM) (
repr_lm,repr_gam) - Exponential smoothing seasonal coefficients (
repr_exp)
- Mean seasonal profile - Average seasonal profile, Median seasonal profile, etc. (
- Data dictated:
- FeaClip - Feature extraction from clipping representation (
repr_feaclip,clipping) - FeaTrend - Feature extraction from trending representation (
repr_featrend,trending) - FeaClipTrend - Feature extraction from clipping and trending representation (
repr_feacliptrend)
- FeaClip - Feature extraction from clipping representation (
Additional useful functions are implemented as:
- Windowing (
repr_windowing) - applies above mentioned representations to every window of a time series - Matrix of representations (
repr_matrix) - applies above mentioned representations to every row of a matrix of time series - Normalisation functions - z-score (
norm_z), min-max (norm_min_max) - Normalisation functions with output also of scaling parameters - z-score (
norm_z_list), min-max (norm_min_max_list) - Denormalisation functions - z-score (
denorm_z), min-max (denorm_min_max) - Forecasting accuracy measures - MSE, MAE, RMSE, MdAE, MAPE, sMAPE, MAAPE, MASE
Usage
library(TSrepr)
library(ggplot2)

data_ts <- as.numeric(elec_load[5,]) # electricity load consumption data
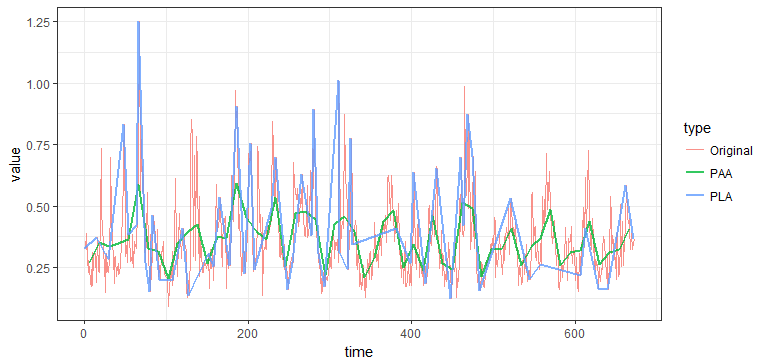
# Comparison of PAA and PLA
# Dimensionality of the time series will be reduced 8 times
data_paa <- repr_paa(data_ts, q = 12, func = mean)
data_pla <- repr_pla(data_ts, times = 55, return = "both") # returns both extracted places and values

data_plot <- data.frame(value = c(data_ts, data_paa, data_pla$points),
                        time = c(1:length(data_ts), seq(6, length(data_ts), by = 12), data_pla$places),
                        type = factor(c(rep("Original", length(data_ts)), rep(c("PAA", "PLA"), each = 56))))

ggplot(data_plot, aes(time, value, color = type, size = type)) +
  geom_line(alpha = 0.8) +
  scale_size_manual(values = c(0.6, 0.8, 0.8)) +
  theme_bw()
For more information
- Check my blog post at petolau.github.io/TSrepr-time-series-representations,
- Check my blog post about clustering time series representations at petolau.github.io/TSrepr-clustering-time-series-representations,
- Blog post about using FeaClip representation in multiple data streams clustering at petolau.github.io/Multiple-data-streams-clustering-in-r.
Contact
For any suggestions and comments write me an email at: tsreprpackage@gmail.com
Citation
Cite the package as:
- Laurinec, (2018). TSrepr R package: Time Series Representations. Journal of Open Source Software, 3(23), 577, https://doi.org/10.21105/joss.00577
